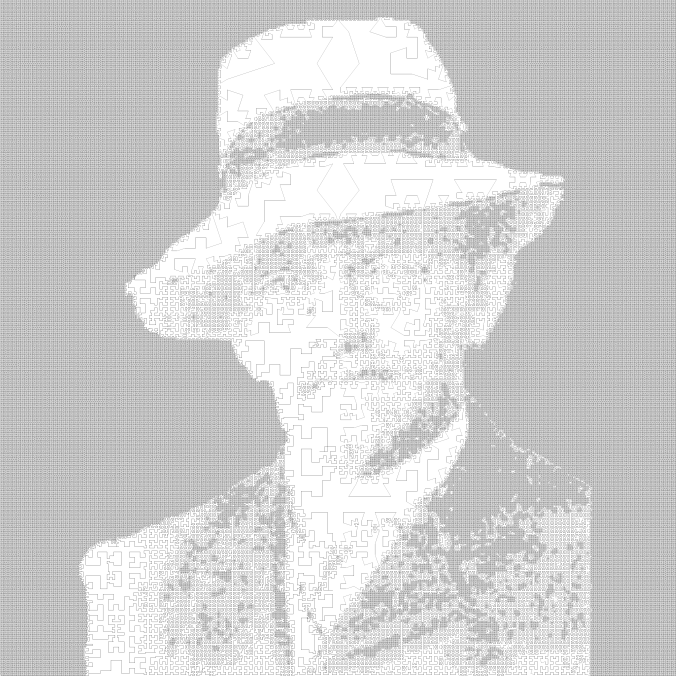
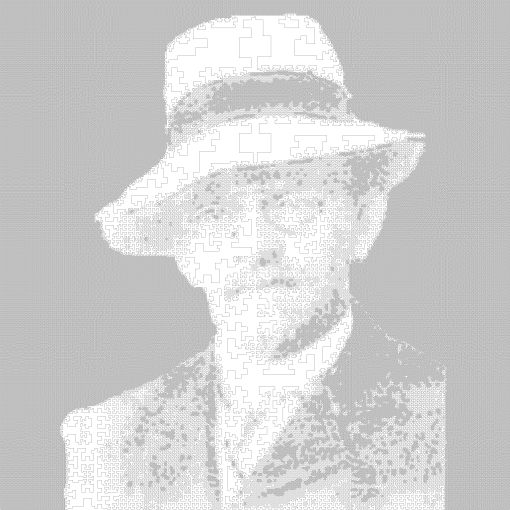
In case you missed it, you can click on the image to view it at its full resolution (4096 by 4096 pixels). I highly recommend doing so- for one thing, that background’s not gray.
If you’ve seen any of Robert Bosch or Craig Kaplan’s artwork based on the Traveling Salesman problem (thanks to George Hart for the links), this should look familiar: both are created with a single loop (or, in this case, a line), and appear to be pictures of faces.
So what is it? Simply, it’s a picture of David Hilbert, made out of a Hilbert curve. To create this image, Bill Gosper and I wrote a program which repeatedly subdivided each section of the fractal using a quadtree, until the desired darkness value was reached, with a maximum recursion depth of 10. However, due to the way the Hilbert curve is defined, many tilted lines were created when adjacent nodes of the quadtree were at different depths:
 To solve this, we had a rendering program interpolate between the different depths using a sort of Z-shaped connector (For more on this, see the bottom of the post)
The same technique can be used on other fractals, as well. For example, here’s the considerably simpler “Peano(Peano)” curve:
Note the better contrast, mostly due to the thicker line width.
Lastly, here’s the more technical explanation for how this was done, copied verbatim from the math-fun thread:
“Okay, so it may be a bit kludgish, but here’s how we generated the
Hilbert(Hilbert) picture, in case anyone’s interested in the technique:
We were originally inspired by Brian Wyvil’s work, specifically his portrait of
Bill Gosper using a flowsnake curve. He’s apparently done quite a bit using
fractals to indicate values in images, even going so far as to write a drawing
program which automatically produces the curve and colors it in real-time.
While his program doesn’t have to deal with quite so many line segments, he
did decide to use fractional iterations (i.e., interpolated between two
levels) of the fractal, which was something we wanted to avoid.If I remember correctly, Bill wanted to create a portrait of Hilbert using a
Hilbert curve right away, but due to some technical problems (described below)
we started out trying to create a portrait of Peano using a Peano curve. The
technique for doing this is fairly simple:
Starting with an initial, preferably square image (we used the one from
http://en.wikipedia.org/wiki/Giuseppe_Peano ), and a level n curve,
– For each edge, sample the image around the line and return the
minimum value of the samples
– If this value is less than the “expected brightness” of the current
iteration depth (currently, naively computed as 1-n/maxDepth), subdivide
that edge according to the current fractal system.
Repeat this until the iteration depth meets the maximum depth, at which point
the line segments will create an approximation to the original image.Here’s the result using this technique:
http://neilbickford.com/assets/peano-frac-2.png
(5.87 MB, try peano-frac-small.png if that’s too large)Aside from some noticeable problems, such as the clear difference in grays
produced by only using 7 iterations, this technique works fairly well. However,
Hilbert(Hilbert) involves some additional difficulties- specifically, the
recursion always adds additional line segments, and the spacefilling path only
begins and ends at 0 and 1 in the limit (that is, iteration n goes between
(1+I)/2^n and 1-(1-I)/2^n). The source image we used for Hilbert
( http://en.wikipedia.org/wiki/File:Hilbert.jpg ) also doesn’t have as many
hard edges as the image for Peano, and there are many fine details, such as the
hairs in his beard or his glasses, some of which aren’t very clear in the final
picture.This means that not only did we have to modify the above algorithm to recurse
on points, but also that we had to come up with some way of connecting parts of
the curve that were in two different recursion depths using only orthogonal
lines. Our original idea was to connect the pieces using parts of the Hilbert
curve itself, and while we did have a sort of proof of concept
(screenshot at http://neilbickford.com/assets/hilbinterpolation.png ), it was
incredibly finicky to work with, and I eventually gave it up.
(It’s not impossible, though, and it’d be neat if someone came up with a
version that actually followed the Hilbert curve)Once we got the code working, we soon found out that it would be necessary to
go down to level 9 to get a good result. This immediately led to the discovery
of the memoization bug in Mathematica, which Gosper covered in an earlier
email. Once <i>that</i> was fixed, we got an image which is at least passable:
http://neilbickford.com/assets/hilbinterpolation.png (2.62 MB)
Notice how in areas where the original image was textured, such as Hilbert’s
suit, almost all the lines are slanted.However, you’ll notice that the final image does have straight lines.
Okay, I’ll admit it: we cheated a bit. Bill suggested moving the vertices
around until the the lines were straight, so I wrote out the coordinates to a
file (available at http://neilbickford.com/assets/hilblines.zip ), then wrote a
C#/XNA program to nudge everything around until it looked about right.
Once that was finished, the program saved the image out to a file, which was
what Bill posted at the top of this thread.It should be noted that there was a lot of trial-and-error in finding the
correct parameters to get a good image involved in this process- for example,
the rendering program would sometimes round off the corners too much and
actually reduce the number of iterations in the curve, or wind up with
intersecting edges. Typical failures looked like Ulysses S. Grant with a hat;
at worst, Bill compared the resulting image to Freddy Kreuger.
One interesting result was that a black background worked best; not only did it
provide high contrast with the edge of Hilbert’s face, but it also set the
minimum recursion level to a high enough value that smaller details are visible.Lastly, some things about the final picture could be improved. I didn’t let the
rendering program run for long enough, and so intersecting and even slightly
slanted lines can still be seen, although they’re not very visible.”
The method of moving the vertices around has since been replaced with another method, specifically:
Given the two endpoints, p0 and p3,
If the segment in question is pointing more vertically than horizontally
(i.e. (p3-p0).{0,1}/||p3-p0||>1/sqrt(2)), insert the pointsp1={p0.x,(p0.y+p3.y)/2} and
p2={p3.x,(p0.y+p3.y)/2}.
Otherwise, do the same thing, but with
p1={(p0.x+p3.x)/2,p0.y} and
p2={(p0.x+p3.x)/2,p3.y}.
where v.x and v.y represent the x and y components of v, respectively
(or if you prefer, x={1,0} and y={0,1} and the period is a dot product)This certainly isn’t new or novel, but it works in the case of connecting parts
of multi-level Hilbert curves.


This looks pretty cool, but there are patches of sharp transition points between patches of shades. Have you considered dithering the regions?